130921
GUEST BLOGGER Robert J. Gordon

______________________________________________________________
SERIES
In August 2012 the noted American economist Robert J. Gordon raised the deliberately provocative question “Is U.S. growth over?” After much debate among economists, Gordon has updated his argument in a recent paper, which this Series provides.
This Post shows how growth SLOWED between the periods 1891-1972 and 1972-2007. The second Post will analyze HEADWINDS facing attempts to revive growth. The third Post will reiterate that those Headwinds are likely to offset future technological INNOVATION.
All this should greatly interest Chinese. If future USA growth remains slow, that will strongly affect the PRC. To some extent the future of USA growth will also become the future of PRC growth, eventually. Chinese may wish to do similar analysis of China’s own growth.
_______________________________________________________________________
INTRODUCTION 1
A MODEL 2
HISTORICAL TRAJECTORY 3
HISTORICAL PERIODS 4
PROJECTIONS VERSUS PERFORMANCE 5
REFERENCES
________________________________________________________________________
130921
IS AMERICAN ECONOMIC GROWTH OVER? HOW GROWTH SLOWED
Robert J. Gordon
Northwestern University and National Bureau of Economic Research
[This Post has been excerpted by Winckler from Robert J. Gordon 2013 "'Is U.S. growth over?' One year later. Reinterpretations, criticisms, and reflections." Prepared for 11th Annual Conference, Center for Capitalism and Sociey, Dynamism and innovation in the West: Has decline set in? Columbia University, New York City, September 16, 2013. Here a few simplifications or explanations by Winckler appear in brackets. The section on Projections versus Performance has been moved to this Post from later in the 130916 paper (where it was Part 4). Non-technical readers can follow the main argument through key statements that Winckler has bolded. More technical readers may wish to attempt similar analysis of Chinese economic growth. REFERENCES for all three Posts are attached to this first Post. Gordon’s August 2012 paper was summarized in this Blog in its first Post, 130105, Section 3.3.]
INTRODUCTION 1
One year ago I released a NBER Working Paper titled "Is U. S. Economic Growth Over? Faltering Innovation and the Six Headwinds" (Gordon 2012). The prediction was that over some indefinite period of time into the future, perhaps 25 to 40 years, the growth of real per-capita disposable income of the bottom 99 percent of the income distribution would average 0.2 percent per year, compared to 2.0 percent per year in the century before 2007.
[In the 2012 paper, the explanation was twofold. First, future technological innovation is unlikely to be as robust as that which has driven American economic growth in the past. Second, for the foreseeable future, the American economy faces at least six "headwinds" involving demography, education, inequality, debt, globalization, and energy/environment.] As shown in this sequel paper, the most important contributors to the transition from 2.0 to 0.2 percent annual growth are not a "faltering of innovation" but rather the influence of the headwinds themselves. [The four main headwinds reduce expected growth from 2.0 to 0.8; a slowdown in innovation since 1972 reduces growth further to 0.2.]
[Thus the] most important point of this sequel paper is that the faltering of innovation happened 40 years ago, not now. The epochal set of inventions that occurred between 1870 and 1900, with continuing benefits to 1972, are combined here as the "Second Industrial Revolution" (IR #2). The growth rate of American productivity between 1891 and 1972 was 2.35 percent per year, compared to 1.55 percent per year in the four decades since 1972. That permanent decline of 0.8 percent per year in my interpretation represents a specific measurement of the extent to which the third digital industrial revolution (IR #3) fell short of the multi-dimensional second industrial revolution (IR #2).
As a result, innovation in the future can continue at the rate achieved in the past 40 years, and my pessimistic forecast will still be valid because the headwinds cut the growth rate of real disposable income of the bottom 99% so far below the projected growth rate of productivity. I can raise a skeptical voice as to whether future innovation will be as important as the many ways that the computer revolution has impacted productivity over the past four decades, but no such skepticism is needed for my forecasts to come true.
This sequel paper compares the actual condition of the current 2013 U.S. economy with both optimistic and pessimistic future growth paths included in the original paper. By any measure, the U. S. economy continues to operate below even the most pessimistic projected post-2007 growth path, and as we shall see real per-capita income (for everyone, not just the bottom 99%) is still below its level achieved in 2007:Q4. In this sense, we do not have to wait for several decades to assess the pessimistic growth path, because the economy continues to underperform that path, much less show any resemblance to a repeat of the 2.0 percent pre-2007 growth rate.
A MODEL 2
The organizing principle to understand the significance of the headwinds is nothing more than a simple IDENTITY: the standard of living measured by output per capita (Y/N) by definition equals productivity or output per hour (Y/H) times hours per capita (H/N). This relates total output (Real Gross Domestic Product or Y) to aggregate hours of work in the total economy (H) and the total population (N). Any factor that reduces the growth of productivity or of hours per capita must by definition reduce the growth rate of the standard of living, that is, output per capita.
The headwinds can be introduced by an indication of their role in slowing future growth in per-capita real output.
The first, DEMOGRAPHY, reduces hours per capita. It thus drives a wedge between the growth of productivity and the growth of output per capita.
The second headwind involves EDUCATION, which directly reduces productivity growth and pari passu translates directly to slower per-capita output growth without any necessary implications for hours per capita.
The third headwind is growing INEQUALITY, and this does not directly impact any of the terms in [our Identity], but rather limits the access of the bottom 99 percent of the income distribution to the average per-capita income gains implied by growth in productivity and hours per capita.
The fourth headwind [DEBT] is the eventual need to raise taxes or reduce the growth of transfer payments to put the budgets of the federal, state, and local branches of government on a solid long-run foundation. This also does not directly impact the elements of [our Identity], but rather reduces the growth of disposable income relative to pre-tax, pre-transfer income.
Two additional headwinds were introduced in the "Is Growth Over?" paper – globalization and energy/environment. While these are discussed below, no numerical quantities are proposed here for their impact on future growth. They will reappear subsequently in the context of critiques and rebuttal.
HISTORICAL TRAJECTORY 3
The historical record of U. S. growth in real GDP per capita is shown on a log scale in Figure 1
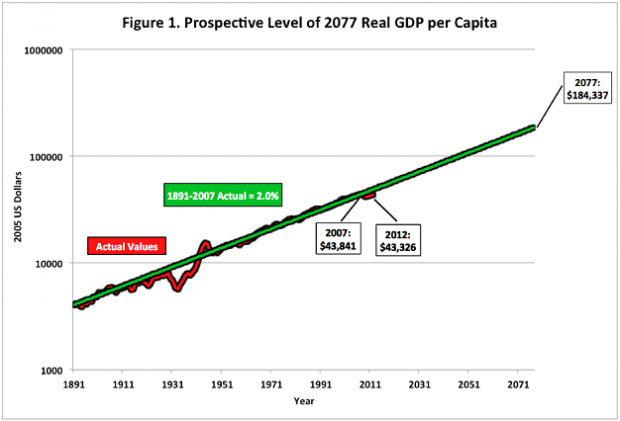
for the 12 decades between 1891 and 2012. Seen via this wide-angle lens, it appears that economic growth is a steady and relentless process at 2.0 percent per year, through the
vicissitudes of the Great Depression, World War II, and countless prewar and postwar recessions. The green line traces the 2.0 trend and extends it out 70 years to 2077.
Notice that the wide-angle lens hides the fact that per-capita GDP in 2012 was actually lower than in 2007, rather than the 10 percent higher that would have been implied by a 2.0 percent annual growth rate. The "rule of 70" implies that any quantity growing at 2.0 percent per year doubles in 35 years and quadruples in 70 years. Hence the projection of the green line soars from a per-capita income of $43,841in 2007 to a much higher $184,397 by 2077.
In the context of [our Identity], on average between 1891 and 2007 real output per capita grew at 2.0 percent per year, slower than the 2.2 percent growth of productivity because hours per capita declined by an average of 0.2 percent per year. We would expect hours per capita to decline in the long-run as workers and households choose to spend some of their rising living standard on a reduction in hours of work. Part of the epochal transformation in the quality of life that occurred in the first half of the 20th century was the reduction of weekly working hours from 60 to 40 hours per week in manufacturing, and by almost as much in other industries.
HISTORICAL PERIODS 4
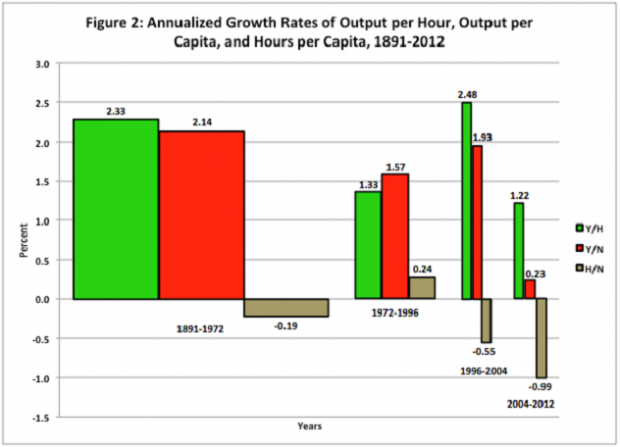
Figure 2 puts [our Identity] into motion by dividing the 121 years since 1891 into four shorter intervals, with the length of each interval indicated by the width of the bars. The height of each bar is measured in annual growth rates; the green bar is for productivity, the red bar for output per capita, and the grey bar for hours per capita.
Each of these four intervals has distinct characteristics. The first for 1891-1972 displays the normal tendency of hours per capita to decline, by definition forcing output per capita to grow more slowly than productivity.
This relationship was reversed in the next 1972-96 interval, the core period in which females moved from home into market work and during which hours per capita increased by 0.24 percent per year. This allowed output per capita to grow at 1.57 percent, that is, 0.24 percent faster than productivity growth. Note that productivity growth itself declined by a full percentage point between the first two intervals, which I shall interpret below as a measure of the importance of IR #2 the second industrial revolution and the innovation it created between 1870 and 1972 relative to the third post-1972 industrial revolution associated with computers and digitalization.
The most fertile period of IR #3 occurred between 1996 and 2004. As shown on the graph, productivity growth soared from the second to the third period from 1.33 to 2.48 percent per year, enough to lift per-capita output growth to 1.93 percent despite a historically unprecedented decline in hours per capita at an annual rate of 0.55 percent per year. What is notable about the third period of 1996-2004 is not only how short-lived was the productivity revival associated with the invention of e-mail, the internet, the web, and e-commerce, but also how much of this short-lived productivity revival was offset by the beginning of a historic decay in hours per capita.
Everything collapsed after 2004. Productivity growth returned from its temporary revival growth rate of 2.48 to a mere 1.22 percent in the eight years ending in 2012. Hours per capita declined at an annual rate of almost one percent per year, leaving the standard of living stagnant, barely increasing at an almost invisible growth rate of 0.23 percent per year. An immediate reaction is that the abysmal results for 2004-2012 can be ignored, because "it's all due to the recession and slow recovery." Unfortunately, the collapse of productivity growth cannot be so easily dismissed, because productivity growth is no longer procyclical. My own econometric research and that of others demonstrates that the regular procyclical responses of productivity changed after the mid 1980s, and that productivity growth now has no regular relationship to the business cycle.
What accounts for the precipitous decline of hours per capita during both eight year periods, both between 1996 and 2004, and then at almost twice the rate between 2004 and 2012? By definition, the ratio of hours per capita is equal to hours per employee, times the ratio of employment to the labor force (that is, unity minus the unemployment rate expressed in decimals), times the labor-force participation rate. In symbols, H/N ≡ H/E * E/L * L/N.
The employment rate made no contribution to the decline in hours per capita between 1996 and 2004, as the employment rate was identical at 94.6 percent in those two years (unemployment rates in each year of 5.4 percent). The employment rate fell from 94.6 percent in 2004 to 92.2 percent in 2012, making a contribution of -0.32 percent per year out of the -0.99 percent per year annual decline of hours per capita. By definition the remaining contribution was made by falling hours per employee ((H/E) and a declining labor-force participation rate (L/N).
The decline in hours per employee and of the labor-force participation rate since 1996 cannot be easily dismissed as a mere cyclical phenomenon that will disappear “once the economy recovers.” Despite the constancy of the employment rate between 1996 and 2004, underlying negative developments in the labor market caused a decline in hours per capita not related at all to a rising unemployment rate. This is part of the demographic headwind.
PROJECTIONS VERSUS PERFORMANCE 5
All the projections in this paper compare the 2.0 realized growth rate of U. S. per-capita real GDP between 1891 and 2007 with alternative forecasts beyond 2007. The horizon date of 2077 is chosen for arithmetic convenience related to the "rule of 70." If real GDP per capita were to continue to grow
 at 2.0 percent per year, it would quadruple between 2007 and 2077.
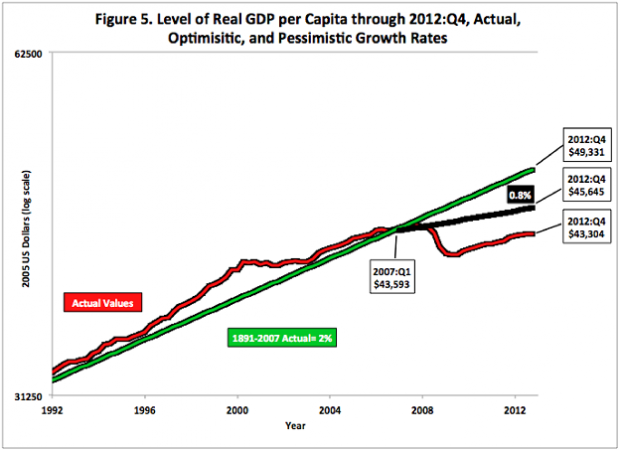
But we are not in 2077 to assess the outcome, but rather we are very near the beginning of the forecast period. The chart above exhibits the level of real per-capita GDP through 2012:Q4 and compares the actual outcome with the optimistic (green line) forecast that growth will continue at 2.0 percent and the pessimistic (black line) forecast of 0.8 percent that takes account of the demographic, educational, inequality, and debt headwinds. This comparison is biased in favor of the actual outcome to date, because this displays average real GDP per capita rather than the realized income of the bottom 99% which is the focus of the pessimistic forecast. Nevertheless it is enlightening to see how far is the economy below that 0.8 percent post-2007 growth path.
If per-capita real GDP had grown at 2.0 percent after 2007:Q4, then by 2012:Q4 the amount would have increased to $49,331. Yet the actual amount of $43,304 fell short of the optimistic prediction by 12.2 percent, and it even was 5.1 percent below the pessimistic black-line forecast that takes account of growing inequality. It is easy to dismiss these ratios as "transitory" because the economy is mired in a "slow recovery." But the recovery shows few signs of acceleration, and even if it did it would require an implausible rate of growth to bring real per-capita GDP back to parity with the pessimistic black line. Meanwhile, when growing inequality is considered, median real household income still remains below its value in 1998.
[The next Post in this Series continues on HEADWINDS]
REFERENCES
Bryne, David M., Oliner, Stephen D., and Sichel, Daniel E. (2013). "Is the Information Technology Revolution Over?" International Productivity Monitor. No. 25, Spring.
Charles, Kerwin Kofi, Hurst, Erik, and Notowidiglo, Matthew (2013). "Manufacturing Decline, Housing Booms, and Non-Employment," NBER Working paper 18949.
Cutler, David M., and Ly, Dan P. (2011). "The (Paper) Work of Medicine: Understanding International Medical Costs," Journal of Economic Perspectives 30 (no. 6), 1174-1187.
David, Paul A. (1990). “The Dynamo and the Computer: An Historical Perspective on the Modern Productivity Paradox,” American Economic Review Papers and Proceedings 80 (May, no. 2), 355-61.
Denison, Edward F. (1962). The Sources of Economic Growth and the Alternatives Before Us. New York: Committee for Economic Development.
Goldin, Claudia, and Katz, Lawrence F. (1998). The Race Between Education and Technology. Cambridge and London: Belknap Press of Harvard University Press.
Gordon, Robert J. (2010). "Okun's Law and Productivity Innovations," American Economic Review Papers and Proceedings 100 (May, no. 2), 11-15.
Gordon, Robert J. (2012). "Is U. S. Economic Growth Over? Faltering Innovation Confronts the Six Headwinds," NBER Working Paper 18315, August.
Gordon, Robert J. (2013 forthcoming). Okun's Law and the Slow Recovery: Implications for Potential Output, Employment, and Productivity Growth. Working paper in progress.
Kendrick, John W. (1961). Productivity Trends in the United States. Princeton: Princeton University Press for NBER.
Markoff, John (2013). "In 1949, He Imagined an Age of Robots," New York Times, May 21, D8.
Mokyr, Joel (2013). "Is Technological Progress a Thing of the Past?" EU-Vox essay posted September 8, downloaded from:
Murray, Charles (2012). Coming Apart: The State of White America 1960-2010. New York: Crown forum.
Smil, Vaclav (2005). Creating the Twentieth Century: Technical Innovations of 1867-1914 and Their Lasting Impact. Oxford and New York: Oxford University Press.
Vijg, Jan (2011). The American Technological Challenge: Stagnation and Decline in the 21st Century. New York: Algora Press.
Watkins, John Elfreth, Jr. (1900). "What May Happen in the Next Hundred Years," Ladies Home Journal (November), 8.
Wells, H. G. (1902). Anticipations of the Reaction of Mechanical and Scientific Progress Upon Human Life and Thought. London: Chapman & Hall.
________________________________________________________________________
GUEST BLOGGER
Economist Robert J. Gordon is one of the USA's leading experts on the current productivity of the American economy. He is writing a book on the technological revolution that propelled American economic growth between about 1891 and 1972. In August 2012 he published a paper asking the deliberately provocative question “Is U.S. Economic Growth Over?”

Gordon's purpose was to alert American economists and policy-makers to the possibility that, as they continued to attempt to speed “recovery” from the 2007-2009 Great Recession, they could not count on a return to the high rates of growth to which Americans have become accustomed. His question has indeed provoked much debate among American economists.

0
推荐
 京公网安备 11010502034662号