130420
AMERICAN LOCALITIES
Histories of Futures
____________________________________________________________________________
DIMENSIONS OF POLITICS DIMENSIONS OF POSTS
Sectors: All Importance: *****
Level: Subnational Scope: USA only
Period: Long run Process: Power politics
TOPIC: LOCALITIES Treatment: Background.
____________________________________________________________________________
OVERVIEW
STATES 1
Republican and Democratic 1.1
Regions and zones 1.2
Congressional districts 1.3
COUNTIES 2
Overview 2.1
Core and periphery 2.2
Bands and points 2.3
DYNAMICS 3
Political dynamics, outcomes, and attitudes 3.1
Economic dynamics and political outcomes 3.2
Cultural dynamics and political outcomes 3.3
____________________________________________________________________________
SERIES
This is one in a series of Posts sketching HISTORIES OF FUTURES of American politics. The series tries to identify processes that have run through most of American historical political development, continue today, and may well continue into the future.
This Post is the second of two on subnational formations that shape American politics. The first sketched ETHNOREGIONS resulting from past immigration and settlement (130413). This Post treats America’s current patchwork of diverse types of LOCALITIES.
Earlier Posts outlined the successive GENERATIONS in American political history (130316, 130323) and historical tensions within American political IDEOLOGY (130330, 130406). Later Posts will trace the succession of political REGIMES in American political development.
____________________________________________________________________________
from
OVERVIEW
In 2004 Barack Obama famously riffed against the media division of America into “red states and blue states” or Republican states versus Democratic states. Nevertheless, the USA’s 50 states remain important practical units in American national elections, particularly plurality elections for president. So the first half of this Post begins by acknowledging their role.
Nevertheless, American states are too large and diverse to have meaningful qualities, either ideological and political leanings; or social, economic, and cultural commitments. Actually, the smaller the spatial unit, the more meaningful it is to say that it tends to be conservative or liberal, Republican or Democratic, rich or poor, religious or secular, or whatever. Localities (counties) and communities (urban neighborhoods, small towns) are important, not just as an aggregation of individual characteristics, but as establishing distinctive environments within which individuals function.
So even casual commentary regularly goes beyond whole states to at least the two or three main parts of the more important states. Accordingly, the first third of the Post continues by noting different ways of dividing STATES up into parts. States map onto natural regions, each with distinctive characteristics that distinguish different parts of a state. States also map onto metropolitan structures, running from urban through suburban to rural and beyond. Finally, overlaid on these natural spatial formations are the 435 artificial political districts that elect the USA’s 435 Members of Congress.
The first third of this Post draws examples mostly from California, New York, and Texas, because they are the three most populous states with the most electoral votes. In national politics, California and New York are firmly liberal-Democratic. Texas used to be conservative-Democratic but has long been firmly conservative-Republican. However, Texas now bears watching because it is POSSIBLE that within a decade or so it will turn into a “swing” state or even become liberal-Democratic. If that happens, it will become quite difficult for Republicans to win national presidential elections.
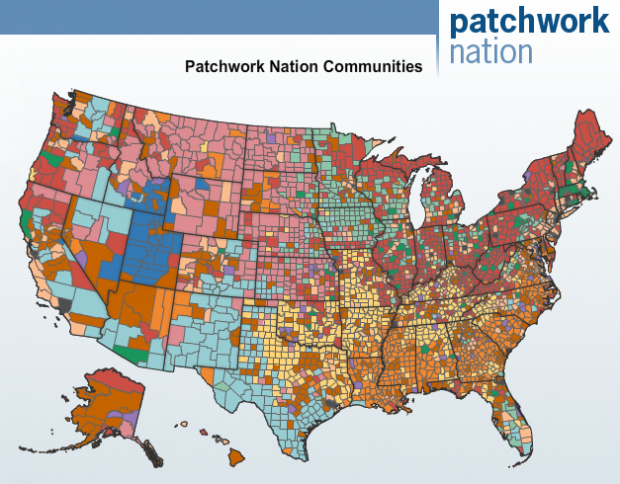
The middle third of the Post reports a clever recent analysis of the COUNTIES in the USA (3141, about the same number as in China, although on average China’s counties have about four times as many people). That analysis identifies twelve main types of counties scattered across the USA, which the authors claim make the nation a “patchwork.” The authors argue persuasively that counties are small enough units to constitute meaningful life-spaces for individuals that influence their political behavior. The twelve different types of counties have different economic bases, cultural backgrounds, and political inclinations. They experience and respond quite differently to the same national events, such as the Great Recession or the Obama administration.
Although the patchwork authors don’t put it this way, six of their types are relatively SYSTEMATIC in their locations and characteristics. These six types range from the inner core to the outer periphery of large regional systems. (This is similar to the urban-rural continuum mentioned above, but often on a larger scale – from the inner core of the inner core of the nation as a whole to the outer periphery of the outer periphery of the nation as a whole.) These six types of localities fall into three concentric zones. First, two CORE types of locality fall within the densely-populated cores of metropolitan regions: the economically unequal URBAN core, and the relatively prosperous SUBURBS. Second, two MIDDLE types of locality are intermediate between core and periphery: would-be-wealthy EXURBS and barely-surviving small TOWNS. Third, two PERIPHERAL types of locality are sparsely populated: RURAL, largely agricultural counties and REMOTE counties to which religious dissidents retreated (Mormons).
The other six types of counties are relatively IDIOSYNCRATIC in their origins and characteristics, the products of large historical processes (leaving bands of similar counties) or important contemporary functions (concentrated at points). Thus four of these types form conspicuous BANDS running across several states, bands that reflect large processes that were important in American history (particularly the Civil War). The two more populous bands are the relatively poor and evangelical BIBLE BELT and BLACK BELT, both severely damaged by the Civil War and poor ever since. Of two more bands, one is the relatively poor and heavily Catholic LATINO LOCALITIES near the Southwest and West borders with Mexico, reflecting historical conquest and current large-scale immigraiton. The other is the AGING ENCLAVES of workers from the upper-MidWest Rust Belt and retirees from there in their retirement communities, particularly in Florida (but also in the Southwest, where their populations are juxtaposed with Latino immigrants). The remaining two types are POINTS for performing specialized functions: EDUCATION and MILITARY.
The last third of this Post explores some of the functional DYNAMICS that define the political, economic, and cultural character of America’s localities. Politically, Democratic strength falls off from core to middle and peripheral zones and Republican strength correspondingly rises. Economically, the presence of exceptionally high incomes does fall off across zones, and unemployment does fall off in the outer zone. Aside from that, however, economic patterns are more complex than political ones, suggesting that politics is not a simple reflex of levels of income or unemployment. Indeed, as Chinni and Gimpel argue, what matters politically are the particular kinds of economic hardship inflicted on particular kinds of localities as a result of the particular kinds of economic activities driving them. Culturally, the contrasts are sharpest between localities with cultural specializations: for example, on the one hand, the secular lifestyles of the prosperous suburbs and educational centers and, on the other hand, the religious lifestyles of the Bible Belt and Mormon localities. But there are significant inflections and exceptions in theses overall patterns that repay understanding.
STATES: REPUBLICAN AND DEMOCRATIC 1
Whole states go to one party or another in presidential elections. Natural parts of states have distinctive political coloration. A states’s congressional districts can be artificial worlds of their own.
Parties 1.1
In the 2000s, commentary on American politics has designated states won by Republican presidential candidates as “red” and states won by Democratic presidential candidates as “blue.” This is actually the opposite of the association – traditional in both Europe and America – of red with radical and blue with conservative. So, as usual, the USA has managed to get classical European political labels backwards (as in whether “liberal” means against state regulation of the economy or for it.) The red-blue reversal is not a matter of mass American ignorance. Actually, the backwards usage was imposed in 2000 by famous media commentators who should have known better. (See Wikipedia on “Red states versus blue states” for a useful article, with maps.)
Classified as Republic or Democratic, states fall into two coalitions of several subnational regions each: the Red Republican Heartland and South against the Blue Democratic two Coasts and North. Of course, popular discourse allows also for “purple” states that are mixed or in transition and therefore up-for-grabs (“swing” states). In 2000s elections the most important swing states have been Florida (now 29 electoral votes), Ohio (18), Virginia (13), Colorado (9) and Nevada (6). (For analysis of such matters see Nate Silver’s FiveThirtyEight blog at The New York Times.)
The main underlying map probably remains that in the 2000 presidential election, with Democratic states on the east and west coasts and Republican states in between. In 2008 Democrat Obama managed to carry some of the in-between states that normally are Republican, but some of thosereverted to Republican in 2012. Meanwhile, a few states have turned purple (e.g., formerly Republican Virginia),, and a few that were purple are beginning to look rather blue (e.g., newly Democratic Colorado).
The Red-Blue classification is somewhat informative for national presidential and senatorial politics, less so for national representatives, and often misleading for state politics itself. As regards the 100 national Senators, partisan distinctions between whole states remain of some use: usually most of the Democrats elected as senator from mostly Republican states are quite conservative. However, as regards the 435 national representatives in the House, it is not the partisan characteristics of the 50 whole states but only the partisan characteristics of the 435 congressional districts that matter. As for the state and local level, even as Democrats captured the presidency in 2008 and 2012, many subnational units were trending Republican.
Political scientists have designed quite sophisticated measures of the extent to which states are liberal or conservative, usually expressed as their degree of liberalism. One version of such an index, based on the degree of liberalism of actual state policies in 2005, ranks California as the most liberal state, New York as the third most liberal, and Texas as the 41st most liberal (Gray in Gray and Hanson eds. 2008, 2-5). Such liberalism of policy correlates strongly with liberalism of public opinion (ibid, 22-24). Another recent analysis of some states, based on the voting records of state legislators, confirms that California is by far the most liberal state. By comparison, liberal New York is only moderately liberal. (Virginia Gray and Russell L Hanson eds. 2012 Politics In The American States: A Comparative Analysis. Washington DC: CQ Press, 570 pages.)
Regions and zones 1.2
Other political scientists have pursued still further refinements in analyzing and measuring state political orientations. They characterize the changing socio-cultural composition of the populations of spatial parts of states. They also consider the influence of those substate contexts on the thinking of individual voters in particular elections.
In some states there really are strong regional distinctions: for example, within California, Democrats are strong along the coast (from San Francisco to Los Angeles) and Republicans are strong in the interior (the Central Valley and Sierra foothills). As in California, such regional distinctions can be of relatively recent origin, caused by the recent movement of old populations (in California, conservative whites from coastal to interior) and the arrival of new populations (in California, liberal Latinos and Asians arriving on the coast). In Texas, Democrats are concentrated among the minorities in the east-central cities (Houston and Dallas, particularly blacks and Latinos) and along the border with Mexico (El Paso, mostly Latinos). So far, the rest of Texas remains mostly non-Hispanic white and Republican.
Within states, an increasingly universal and salient distinction is that between the concentric zones of urban and suburban, rural and outer periphery. Urbanites tend to be Democratic, suburbanites have tended to be mixed or swing voters (though are now trending Democratic), and ruralites and “peripherals’ tend to be Republican. The urban-suburban-rural continuum has its largest and strongest expression in New York State. Urban New York City contains most of the state’s Democrats. The metropolitan suburbs of New York City are mixed. Mostly rural “upstate” New York has historically been Republican, though the urban cores of upstate cities are Democratic (Buffalo, Rochester, Syracuse, Utica, Albany).
Congressional districts 1.3
The 435 districts from within which the USA’s 435 national House representatives are elected are inherently somewhat fluid. The 1787 Constitution fixed the total number of House representatives at 435, while the Supreme Court has since determined that, as nearly as possible, the districts from which they are elected must include about the same number of voters. As a result, at least some districts are redrawn every ten years to reflect the most recent decennial census. Even so, the striking thing about congressional districts is how much more, in recent decades, they have become artificial. That is, increasingly they do NOT represent any natural “locality” of people with some collective identity and identification. Instead, they consist of whatever collection of households some computer says would yield a particular party or Member of Congress the greatest electoral advantage (that is, if that party or Member has enough influence to obtain those boundaries).
(For informative maps of the 435 congressional districts, see The New York Times’maps of the results of recent elections.)
COUNTIES 2
For more permanently meaningful units, we turn to the USA’s 3141 counties. Here we draw on a clever recent analysis that has produced both a book and a website with additional useful commentary and maps. (Dante Chinni and James Gimpel 2010 Our patchwork nation: The surprising truth about the “real” America: The 12 community types that make up our nation. New York NY: Gotham Books, 318 pages. .)
Overview 2.1
In contrast to congressional districts, counties are NOT periodically redrawn. Instead many have maintained their boundaries for much of American political history. Moreover, counties still perform significant functions of local governance. So they CAN have some local political identity. So they DO help form the local environment that influences people’s political thinking and partisan choices.
Nevertheless, contrary to the usage of Chinni and Gimpel, even the county is NOT a natural, face-to-face “community.” Instead, as Chinni and Gimpel themselves sometimes note, a county is usually a collection of communities such as urban neighborhoods and small towns. This Post uses LOCALITY to refer to the larger local spatial units such as counties that usually have at best weak collective identities. We use COMMUNITY to refer to smaller local spatial units such as urban neighborhoods and small towns that usually have stronger collective identities.
Of course, no one can remember the characteristics of 3000 different counties. Accordingly, Chinni and Gimpel helpfully distinguish twelve different TYPES of counties. Their book has three parts. The first presents profiles of twelve communities that are (somewhat) representative of each type. The second part discusses the economic, political and cultural processes that distinguish communities. The third part provides a list of all 3141 American counties, so that anyone can look up any county to see what type it is and what characteristics it has. (Anyone can do the same online at the website.)
On the one hand, Chinni and Gimpel’s method of distinguishing types of localities is quite scientific, using “factor analysis” to identify what distinguishes them and confirming the “validity” of their “construct” by other data. Moreover, they did fieldwork on these different types of places, so their characterization of each type is based on more than just computer printouts. Much of their commentary throughout the book is insightful and even novel. So it is very worth grappling with their patchwork of types.
On the other hand, Chinni and Gimpel are so concerned to make their analysis “accessible” to ordinary readers that their anecdotal approach and cute names for their types of counties conceal as much of the underlying logic of their analysis as it reveals. Worse still, the analysis itself mostly takes counties out of the context of the larger regional systems and historical processes that created them. A really sour comment on Chinni and Gimpel would be that they find the USA to be a patchwork because they do not understand (or anyway do not invoke) the larger spatial processes that the patchwork reflects.
So this Post will present Chinni and Gimpel’s analysis mostly in a different order and in different terms than those used in their book. We shall divide Chinni and Gimpel’s twelve types into two groups of six each, one group SYSTEMATIC, produced largely by recent REGIONAL processes, the other IDIOSYNCRATIC, produced largely by past HISTORICAL processes. Discussion proceeds in those terms. Then the Conclusion redisplays most of Chinni and Gimpel’s basic data in those terms. (Regrettably, Chinni and Gimpel present data on their types, not in its larger regional or historical context, but in the alphabetical order of the arbitrary names they have given their types.)
Systematic types of counties: From regional core to regional periphery 2.2
The six SYSTEMATIC types fall along a standard REGIONAL science continuum from densely populated regional core to sparsely populated regional periphery. Chinni and Gimpel are certainly correct that that continuum does not completely determine the characteristics of localities, even of those localities that DO fall on it. Nevertheless, for those types, their location on the continuum strongly influences their characteristics, even though not always entirely linearly (high or low at the center, low or high at the edge, intermediate in between). A particular characteristic may be distributed in a U shape or inverted U: high or low in the center, high or low at the edge, low or high somewhere in between. Location on the systematic continuum should be considered before introducing more idiosyncratic factors..
The main thing that makes the core-periphery continuum “systematic” is transport logistics: the difficulty and cost of getting back and forth between core and periphery. Transport is usually but not always ECONOMIC. It can also be for SECURITY purposes such as military expeditions and police enforcement. Transport and communications also structure IDENTITY processes such as top-down cultural diffusion and bottom-up cultural differentiation.
We will think of the localities that do fall on the core-periphery continuum as three pairs of types falling into three zones: core, middle, and periphery.
CORE. The first pair falls within the “metro” core: URBAN localities themselves (only 41 counties but with 59.3 million population) and the relatively prosperous SUBURBS (286 counties with 69.1 million population). Politically, Urban counties are solidly Democratic, mostly on the economic grounds of need for government social programs. Because the populations here are both large and reliable, they provide the main Democratic electoral “base.” Suburban counties – now the MOST populous and politically influential type – have often been “swing” places potentially available to either party. However, in recent presidential elections Suburbs have increasingly become Democratic – crucial to Obama’s re-election in 2012.
MIDDLE. The second pair of types of locality falls in the middle between core and periphery: the would-be wealthy EXURBS (384 counties with 53.9 million population) and the scattered small service TOWNS (663 counties with 31 million population). On many characteristics, the main “fall-off” in the distribution of characteristic occurs between the core pair of types and the middle pair of types. This is true of politics. Whereas both Urban and Suburb vote Democratic, both Exurbs and small Towns vote Republican
PERIPHERY. The third pair of types falls in the periphery: RURAL, mostly agricultural localities (311 counties with only 2.3 million population) and a nationally REMOTE area of high desert into which Mormons retreated to escape government control (44 counties, 1.7 million people). Politically, both Rural and Remote counties too vote Republican.
Idiosyncratic types of counties: Historical bands and functional points 2.3
The other six of Chinni and Gimpel’s types of county do NOT fall on the systematic core-periphery continuum. Instead they are more idiosyncratic in origin and characteristics. Idiosyncratic does not mean trivial, however. The characteristics of these counties either reflect major processes in American history (bands) or important current functions that those counties perform (points). Again, these processes or functions can be either Economic, Security, or Identity. Four of the types clump together into conspicuous and even familiar BANDS (that the authors mostly don’t mention). Two of the types provide POINTS for a particular specialized function: education and military. Again we will present these types in pairs.
In terms of numbers of counties and people, the two most important bands are the BIBLE BELT of Protestant Evangelical countries in the southern Midwest and South (448 counties, 14.1 million people) and the BLACK BELT in the South in which the large minority black population has its own Protestant evangelical sects (364 counties, 13.5 million people, 38% of them black). Actually the latter category (which Chinni and Gimpel call “minority”) also includes Native American reservations scattered in the West. Those are important historically and ethnically, but not demographically and politically, so here we set them aside. More generally, not ALL evangelical or minority counties are concentrated in those two belts, but instead are scattered elsewhere, validating Chinni and Gimpel’s notion of “patchwork.”
The Bible Belt and Black Belt have common origins in southern slavery and Civil War destruction. To some extent they are reciprocals of each other: Poor whites in the Bible Belt and a large minority of poor blacks in the Black Belt (along with a majority of slightly better-off whites). The Bible Belt counties are very homogeneously white and evangelical. They vote overwhelmingly Republican. Nevertheless, on local issues, the Bible Belt counties are strongly DIVIDED within each county by feuds between their many intense evangelical sects. The Black Belt counties are strongly POLARIZED within each county between majority Whites and the large minority of Blacks. Evidently enough of the majority whites vote Democratic to enable Democrats sometimes to carry the minority counties by very narrow margins (1%).
Of the next most important pair of bands, one is a belt of heavily LATINO LOCALITIES, some along the USA’s border with Mexico, others elsewhere in the Southwest and West (204 counties, 20.7 million people, 44% of them Latino). The other next band consists of AGING ENCLAVES of older workers in the Upper Midwest Rust Belt and older retirees from there in Florida (250 counties, 12.1 million people). Elders have retired also to the Southwest, where they are juxtaposed with Latinos.
The Latino band results from the American conquest of formerly Mexican territory and the subsequent migration of Mexicans and other Latinos north into that territory. The Latino band has also experienced heavy migration of retirees from the north. Thus these counties too are strongly polarized: between majority whites and minority Latinos, both including both long-term residents and recent arrivals. In 2000 and 2004 the white majorities carried these counties for Republican George W. Bush. Then radical conservative Republicans tried to pass strongly anti-immigrant laws at both the national and state levels. Those attempts mobilized Latinos enough to carry the Latino Localities for Democrat Barack Obama in 2008 and 2012.
Elsewhere, aging white populations resist change and vote strongly Republican: in the upper MidWest where they are still working, in the Florida counties to which they have retired, and also in the Southwestern counties to which they have also retired. That creates another reciprocal relationship: between the northern counties that are the ORIGINS of many white retirees and the southern counties that are the DESTINATIONS of many of them.
Two less populous types complete the list of idiosyncratic counties, both of them POINTS. One is centers of EDUCATION, particularly higher education (71 counties, 13.1 million people). The other is centers of MILITARY bases (55 counties, 8.4 million people). The location of centers of Education follows no discernible spatial logic. Nevertheless, in many characteristics, counties that are strongly shaped by educational institutions tend to resemble the relatively prosperous suburbs (from whom many of the students come and to which they return). However, Educational centers vote even more consistently Democratic than Suburbs. The distribution of Military bases probably follows a political logic of seeing that each state gets at least one. Because the military is now racially diverse, so are the military counties. But, because the military ethos is conservative, these counties vote strongly Republican.
DYNAMICS 3
In conclusion, we reprise some of the main functional dynamics (political, economic, and cultural) that shape spatial formations and political outcomes. We also note the complementary roles of these different functional dynamics in structuring spatial formations, both on the systematic core-periphery continuum and in the idiosyncratic bands and points. We take the opportunity to display some of Chinni and Gimpel’s very interesting data in a format more informative than alphabetical order.
Political dynamics, outcomes, and attitudes 3.1
DYNAMICS: As our presentation of bands and points just indicated, SECURITY dynamics have played a large role in shaping America’s spatial formations. Early settlers placed major cities at militarily strategic points. Religious rebels retreated to the most remote areas to avoidrepression. Wars of conquest (1840s) created bands of borderlands. Civil war (1860s) left both lasting scars (Bible and Black belts) and lasting political commitments (of rural northerners to the Republican party and of southern whites to whichever party represents anti-government conservatism, currently the Republicans). Historically, the federal government has owned much of the land in the High, Far, or Mountain West and continues its strong presence there – in a region that claims to be fervently anti-government. The Second World War (1940s) drew heavily on northeastern industry, but it and the Cold War (1950s) deployed much new industry to the South and West. Both wars dispersed military bases widely across the country, largely in order to maintain broad political support for high defense budgets.
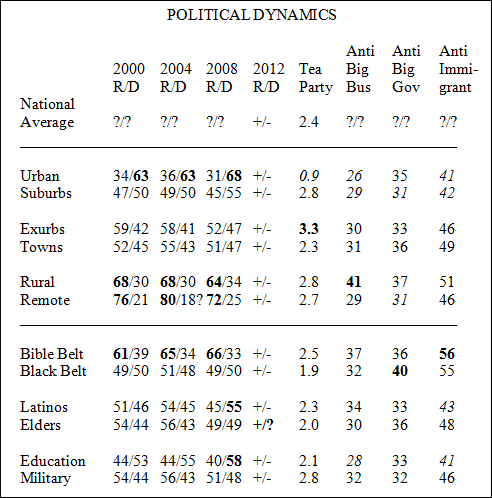
OUTCOMES: Let us quickly reprise political outcomes both along the core-periphery continuum and across the more idiosyncratic types of counties. As the Table below shows, in presidential elections, along the systematic core-periphery continuum, Urban counties are always strongly Democratic (flagged by bolding). The Suburbs have been competitive though slightly Democratic and now are becoming increasingly Democratic. (They again went heavily for Obama in 2012.) Overall, the rest of the continuum becomes more strongly Republican the further out one gets: from the sometimes closer wins of Republicans in Exurbs and Towns, to the perennial Republican “landslides” in the Rural areas and Remote retreats (bolding).
__________________________________________________________
_________________________________________________________
Note: All figures are percentages except Tea Party membership, which
is per ten thousand population. ? marks indicate missing data. Source:
Chinni and Gimpel 2010, tables in the Politics chapter, pages 159-186.
__________________________________________________________
Across idiosyncratic types, the Bible Belt too has Republican landslides (bolded). The Black Belt is remarkably competitive, presumably reflecting its polarization between whites and blacks. Latino Localities have gradually switched from Republican to Democratic, and continued in that direction in 2012. Aging Enclaves of Elders were formerly quite Republican but have become quite competitive. They tied in 2008 and only narrowly reverted to Republican in 2012. Education centers are strongly Democratic, Military centers consistently Republican.
(Unfortunately Chinni and Gimpel have not released final figures by type of county for the 2012 presidential election. In the Table, what the entries in that column mean is that each type of county went for the same party in 2012 that it did in 2008, but with a smaller vote for Democrats. The only type to change was Aging Enclaves.)
ATTITUDES: Finally, Chinni and Gimpel provide some data on political attitudes. Along the core-periphery continuum, Urban counties have the fewest TEA PARTY members per 10,000 population (flagged by italics), Exurban counties have the most (bolded). Across idiosyncratic types, the Black Belt has the fewest Tea Partiers, Military centers the most. Antipathy toward BIG BUSINESS is lowest in Urban and Suburban counties (and in the suburb-like Educational centers). Antipathy to business is highest in Rural counties (and, among idiosyncratic counties, in the Bible Belt, reflecting the difference between traditionalist and economic conservatives). Antipathy to BIG GOVERNMENT is lowest in Surburbs, in Remote Mormon counties (out of patriotism?) and in Military centers (dependent on government employment and dedicated to patriotism). Curiously, antipathy to Big Government is highest in the Black Belt (majority whites resenting government intervention to help blacks?). Finally, antipathy to IMMIGRANTS is lowest in Urban and Suburban counties and in the suburb-like Education centers. Racism is also low in Latino Localities, but not quite so low as in Urban and Suburban counties, presumably reflecting the strong anti-immigrant sentiment among some majority whites.
Economic dynamics and political outcomes 3.2
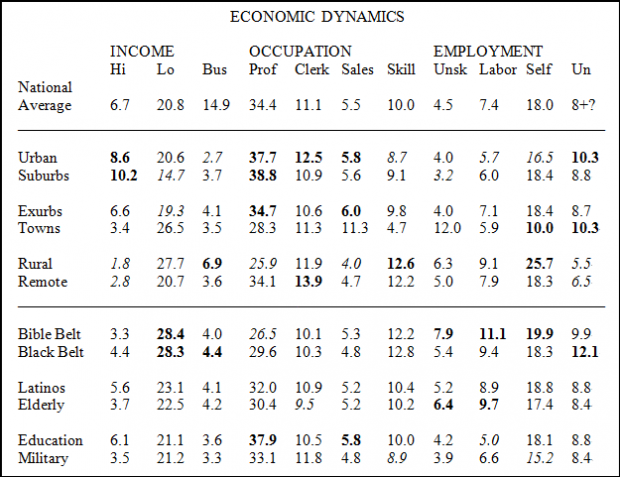
ECONOMIC DYNAMICS are most clearly reflected along the SYSTEMATIC core-periphery continuum. On INCOME, in the metro regions, Urban areas have a high percentage of high income earners, but also a substantial proportion of low income earners, reflecting economic inequality and creating some dependence on Big Government social programs. Suburbs have the highest percentage of high income earners and the lowest proportion of low income earners, reflecting their relative prosperity. Conversely, the Rural and Remote countries have the lowest percentage of high income earners. On OCCUPATION, Urban, Suburban and Exurban counties all have high proportions of professionals. Rural counties have high proportions of businessmen (farmers or agricultural service firms?). Urban counties have a surprisingly low proportion of businessmen. Instead, they are high in clerical and sales (as also Exurbs in sales). Curiously, clerks are highest in Remote Mormon counties (perhaps reflecting lack of alternative employment?). Sales personnel are low in Rural areas but, in EMPLOYMENT, skilled workers are high. Self-employment is high in small Towns and particularly in Rural counties, where farmers consider themselves self-employed.
Among idiosyncratic counties, on INCOME, the Bible Belt and Black Belt both show very high proportions of low incomes, arguably reflecting the lasting damage done to their economies by the Civil War. In OCCUPATION, the Black Belt shows a surprisingly high percentage of businessmen (perhaps mostly white owners of agricultural service businesses?). Education centers are high in professionals and sales. Military centers (not shown) are of course high in military service, both previous and current. In EMPLOYMENT, the Bible Belt shows high proportions of unskilled labor and manual labor, along with high self-employment (farmers?). Latino Localities are mostly average in Occupation and Employment (an average of disparate whites and Latinos?). Aging Enclaves are distinctive only for a high proportion of unskilled labor (why? Old low-quality Rust Belt industrial jobs?) .
____________________________________________________________________________
____________________________________________________________________________
Note: Column eight: Unskilled labor. Column nine: Manual labor. Column ten: Self-employed. Column eleven: Unemployed. Source: Chinni and Gimpel Table 24, pages 232-233. Unemployment from Table 1, page 139, in the Economics chapter, where there is more data.
______________________________________________________________________________
In their economic analysis of POLITICAL OUTCOMES, Chinni and Gimpel emphasize that the Great Recession affected different types of counties differently. As the last column shows, near the height of the Great Recession in July 2009, along the systematic core-periphery continuum, UNEMPLOYMENT was highest in Urban counties and in Towns, lowest in Rural and Remote counties. Across idiosyncratic types, unemployment was highest of any type in the historically disadvantaged Black Belt (high also in the similarly disadvantaged Bible belt) and about average elsewhere. Chinni and Gimpel also calculate economic HARDSHIP scores for the different types of counties at the height of the Great Recession (providing an excellent bar graph but mentioning few precise values). The national average on this score was 21.2, the most hard-hit type the service Towns (23.3). Among the least hard-hit were the Suburbs (19) and Rural counties (19.3), although for different reasons. The Suburbs had been hit harder earlier, but had bounced back quickly. Rural counties were relatively disengaged from domestic financial cycles and more involved in booming foreign markets for their farm products.
Thus the relatively prosperous Suburbs survived relatively unscathed, perhaps helping their willingness to support Obama. Because they had overextended themselves financially, the would-be wealthy Exurbs did not survive the Great Recession as well, perhaps contributing to their unwillingness to support Obama. The small Towns, although lovely places to live, barely get by on modest service worker incomes. Nevertheless, they remained loyal to their Republican traditions. In the Rural counties, people and banks had never taken the financial risks that the rest of the country took. This personal financial conservatism probably reinforces farmers’ fiscal and political conservatism and reinforces their Republicanism. The Remote counties to which Mormons retreated are neither rich nor poor. In the Great Recession they suffered among the least unemployment but among the highest rates of foreclosures on home mortgages. These economic factors might have influenced politics, but here they are over-ridden by religion.
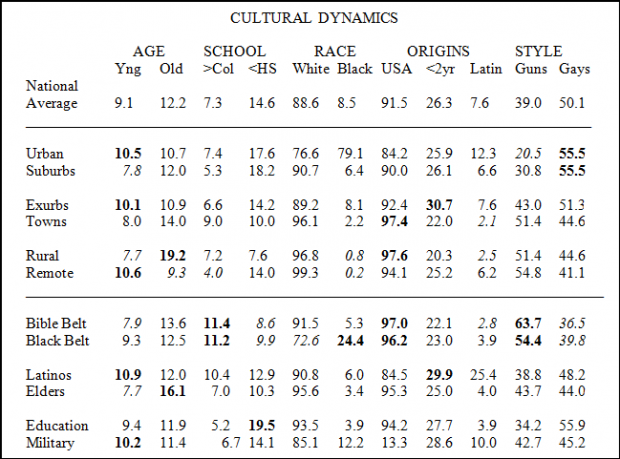
Cultural dynamics and political outcomes 3.3
In their chapter on Culture, Chinni and Gimpel use data on different types of merchandisers to differentiate the cultures of different types of counties (though they don’t distinguish systematic from idiosyncratic effects: 189-192). For example, Starbucks are “systematically” high in Urban-Rural-Exurb counties, along with upscale Whole Foods supermarkets (the latter also in Education centers). In contrast, Walmarts are “idiosyncratically” high in the Bible and Black belts (where the chain originated). Chinni and Gimpel astutely note the “systematic” affinity of the residents of Exurbs for faux-Rural outlets such as Cracker Barrel Old Country Store that “projects the kind of down-home traditionalism they fled more liberal, more urbanized areas to find” (191). Tastes in media involve both systematic and idiosyncratic effects: NPR listening is systematically high in Urban counties and idiosyncratically high in Education Centers. Listening to conservative talk radio is systematically high in Rural areas and idiosyncratically high in the Bible Belt. Peripheral Mormons feel most threatened culturally by the Hollywood culture emanating from the Urban core (205-206).
CULTURAL DYNAMICS are most clearly reflected across the IDIOSYNCRATIC types of counties (Table below). Educationally, the historically disadvantaged Bible and Black belts have the lowest proportion of post-graduate education and the highest proportion of persons who have not graduated from high school. In terms of origins, they also have the highest proportion of persons born in the United States. Culturally, they have the highest proportion of persons who own guns and the lowest proportion who say they know someone who is gay or lesbian.
Latino Localities have the lowest proportion of persons born in the United States and the highest proportion who have resided in their present place for less than two years. They also have (along with Military) the highest proportions of persons 18-25 (reflecting high birth rates among Catholic Latinos or the youth of many immigrants?). Not surprisingly Aging Enclaves have among the lowest proportion of youth and among the highest proportion of elderly (though Rural elderly are even higher). Not surprisingly, Educational centers have the highest proportion of persons with post-graduate education and of persons who know someone who is gay or lesbian. On both characteristics they are followed closely by their kindred Suburbs.
______________________________________________________________________________
______________________________________________________________________________
Note: Second and third columns: More than college, less than high school. Eigth column: Resident less than two years in current location. Column eleven: Percent who say they know someone who is gay or lesbian. Source: Chinni and Gimpel 2010, Table 24, pages 232-233.
___________________________________________________________________________
Among SYSTEMATIC types of counties, proportion of whites mostly increases from core to periphery and proportion of blacks mostly falls. (On both characteristics, the Exurbs introduce a slight blip.) The proportion of US born also increases (although with a slight falloff in the extreme Remote Mormon periphery, which accepts Latino labor). Not shown, the proportion of Asians is highest in Urban and Suburban (3.4 and 2.2), modest in Exurbs (1.4), and quite low in small Town, Rural and Remote counties (0.3, 0.4, and 0.2). The proportion of gun owners increases from core to periphery, except again for a slight fall-off at the edge. Conversely, the proportion of persons who know someone who is gay or lesbian falls off, once again except for a slight reversal in the Mormon outer periphery. Unsystematically, the proportion of youth alternates within pairs: highest in Urban, Exurban, and Remote, lowest in Suburban, Town, and Rural. Odd that youth should be low in Suburbs, which one usually thinks of as places for raising children.
In a fine exercise on the ratio between gun stores and book stores, Ginni and Gimpel find a high correlation between that ratio and voting patterns in the 2008 election (192-195). Democrat Obama carried the types of counties with more than twice as many bookstores as gun stores per capita (Urban, Suburban, and Education). Republican McCain carried the types of counties with more than twice as many guns stores as book stores per capita (Rural areas, the Bible Belt, and Remote Mormon retreats). Nevertheless, although counties with many gun stores definitely went Republican, counties with many book stores did not necessarily go Democratic. Some conservative types of counties have their own high levels of literacy and their own reading habits. (Chinni and Gimpel’s discussion of the incidence of gun stores disappoints by too much reliance on population density and not enough attention to their own theme – differences in culture across types of counties.)
A probing section on religion starts from level of adherence to some faith: highest in Remote Mormon retreats and the Bible Belt, but also surprising high in Aging Enclaves, Rural areas, and Latino Localities (200-204). Chinni and Gimpel note that sheer level of adherence does not correlate well with the performance of Democrat Obama and Republican McCain in the 2008 presidential election. They then usefully stress differences in the roles that religion plays in different types of counties that have high adherence. Religion and religious leaders are politically decisive in the highly adherent Bible Belt because everyone there is Protestant evangelical. Its belief in personal salvation reinforces Republican Individualism. Rural areas contain a mix of denominations, most of which are open to ecumenical dialogue and stress the importance of working together. In contrast, Latino localities are deeply divided between white evangelical Protestants and Latino immigrant Catholics. Aging enclaves have high levels of adherence, but in a variety of churches, mostly not out of strong religious conviction but as a matter of community participation (which Chinni and Gimpel dismiss as “habit,” 204, again underplaying their own theme of “community.”).
As for the political consequences of cultural dynamics, earlier we noted that Bible Belt counties are strongly divided between evangelical sects and that Black Belt counties are strongly polarized between whites and blacks. Here we note that the polarization within the Black Belt counties, although mostly racial, is also religious: between the Mainline Protestant denominations of the whites and distinctive evangelical denominations among the blacks. Elsewhere, it is on religious grounds that the Mormon counties vote strongly Republican.
______________________________________________________________________________
THE SCHEME OF THIS BLOG
DIMENSIONS OF POSTS
Importance of Post: ***** Big development. **** Small development. *** Continuing trend.
Scope of Post: USA only. USA-PRC. USA-other.
Type of Process: Elite power struggle. Elite policy politics. Mass participation.
Type of Treatment: Current commentary. Comprehensive background. Academic analysis.
DIMENSIONS OF POLITICS
Policy Sectors: Security. Economy. Identity
Spatial Levels: Supranational. National. Subnational
Temporal Periods: Shortrun. Midrun. Longrun
STANDARD TOPIC TAGS (BIAOQIAN)
SECURITY
Defense
Diplomacy
Intelligence
Presidency (national security team)
Homeland security
State coercion: Police & Prisons
Citizen violence: Collective riots & Individual harm
ECONOMY
Climate change
Trade & Investment
Fiscal policy
Macroeconomy
Energy & Environment
Business
Employment & Income
IDENTITY
Propaganda
Immigration
Ideology
Race & Ethnicity
Gender & Age
Moral regulation
Alternative lifestyles
SUPRANATIONAL
Global
United Nations
International regimes
Subglobal regions
Major foreign powers
Neighboring countries
Cross-border regions
NATIONAL
Legislative
Executive
Judicial
Parties
Interest groups
Media
Public opinion
SUBNATIONAL
Subnational regions
States
Localities: Metropolitan regions
Localities: Cities
Localities: Counties
Communities & Associations
Citizen participation (elections, activism)
SHORTRUN (Current dynamics)
This week
Past few weeks
Next few weeks
Past few months
Next few months
Past few years
Next few years
MIDRUN (Foreseeable future)
Variables
Cycles
Generations
Regime shift
Transformations
Regime change
Parameters
LONGRUN (History, evolution)
American political development
Comparative political development
Longrun economic growth
Longrun social history
Longrun cultural change
Major civilizations
Human evolution

0
推荐
 京公网安备 11010502034662号